

Network Analysis

In a globalized world, everything is interconnected—political structures, innovation, finance, social trends, economies, and purchasing behavior. Strategies fail because firms attempt to categorize complex systems into a black-and-white category. Removing context favoring superficial classification and simplification creates a massive risk to strategy or investment decisions. At bridge_ci, we quite liberally leverage network and topological data analysis (more on this in another post) as much as possible. Since modern business environments have become more interconnected, volatile, and asymmetrical, organizations need to look at how many people, places, trends, or events influence the system they exist within. And too often, governments and organizations are blindsided by external peripherals. Because organizations fit complex systems into linear dashboards like the one below. The result leads to flawed strategies because they will lack context. This is also why many large language models can hallucinate — their retrieval augmented generation is often built on poorly structured knowledge graphs, but that is a conversation for another day, a conversation for another day. Simply put, most businesses, governments, and organizations create strategies not built around data-quantified modern-day complexities in favor of frameworks, e.g., SWOT and Porter's Five Forces. While these frameworks are beneficial, they can only be used in today’s business or economic environment if backed up and quantified with OSINT, alternative data, statistical analysis, and machine learning.
Standard Business Intelligence Dashboard x DALL-E Visualisation of a Polymorphic Hypergraph Tensor Oscillation (Yes, It’s a Real Thing We Are Researching)

Network Analysis
There is no better technique than network analysis for exploring complex connections between people, regions, events, and trends. Doing so enables one to comprehensively understand a specific domain's relationships, structure, and dynamics. Additionally, it offers a visual and quantitative framework that allows users to explore complex systems, uncover hidden patterns, and derive meaningful insights to inform decision-making processes in various fields, such as business, research, and policy-making.
Advantages
Identify core topics, products, or policy areas that interconnect with other entities (people, location, company, NGO, or government) or product spaces.
Surface undervalued companies or thematics that are central or influential to the sectors or domains dynamics.
Uncover emerging trends, disruptive technologies, or niche markets that may offer investment opportunities.
Assess the potential impact of events or trends in one part of the sector on connected entities or sub-sectors.
Evaluate the resilience or vulnerability of companies based on their positions and relationships within the sector network.
How to Read a Network
Programs Related to Autonomy and AI From The 2024 Naval Justification Books. Node size reflects the 2024 Budget.

In most cases, the closer the nodes or clusters are to each other, the more similar they are. This could be calculated by language similarity using LDA, such as in the example above, or statistical measures, such as correlation, temporal distance, number of connections, or some novel feature-engineered index or ratio metric.
Nodes can represent various entities such as companies, regions, people, and institutions, as well as news articles, reviews, and academic abstracts (basically any text data). By analyzing the attributes and relationships of nodes, investors can identify key players, influential entities, or emerging trends within a sector. For example, a node representing a company with high connectivity to other influential nodes may indicate its central role in the sector and potential for growth or investment. Meanwhile, a public affairs team might look at nodes to identify policy stakeholders or influential academics in a specific domain.
Edges represent the connections or relationships between nodes in a network. The strength or weight of an edge can indicate the intensity of the relationship between two entities, such as the frequency of co-occurrence in news articles or the volume of financial transactions. Analyzing edge patterns can reveal dependencies, collaborations, or information flow between entities, providing insights into sector dynamics and potential risks or opportunities.
Clusters are groups of nodes densely connected internally but sparsely connected to nodes outside the group. Identifying clusters within a sector network can uncover sub-sectors, niche markets, or groups of companies with similar characteristics or behaviors. Investors can analyze the properties and trends within clusters to identify emerging industries, disruptive technologies, or potential investment themes. Renaming clusters based on domain expertise can provide more meaningful and actionable insights.
Key Network Metrics
Network Map of Key People and Clusters Associated with The EU Digital Markets Act Extracted By Natural Language Processing

Degree: A node's degree represents the number of connections it has. Nodes with high degrees are often hubs or key players in the network. Identifying high-degree nodes can help investors spot influential companies or entities that may drive sector performance or innovation.
Centrality: Centrality measures the relative importance of a node within the network. Nodes with high centrality scores are often critical connectors or influencers. Analyzing centrality can identify companies vital to the flow of information, resources, or value within a sector, making them potential investment targets.
Inter-cluster Connectivity: This metric quantifies the degree of connectivity between different clusters. High inter-cluster connectivity may indicate a stronger relationship or dependence between sub-sectors. Investors can assess the potential impact of events or trends in one cluster on the performance of connected clusters.
Page Rank: Initially developed by Google to rank webpage importance, Page Rank is an algorithm that measures the importance of nodes based on the quality and quantity of their incoming connections. In the context of investment analysis, Page Rank can identify highly regarded or influential companies, people, or nodes within their sector, even if they have fewer direct connections.
What to Investigate
Network of Investment Portfolios of Large Pharmaceutical Companies

Proximity and Connectivity: In a network visualization, the proximity of nodes indicates their similarity or relatedness. Nodes closer together or directly connected by edges are more similar or have a stronger relationship than those farther apart or not directly connected. The proximity and connectivity of nodes are determined by machine learning algorithms that analyze various factors such as textual similarity, co-occurrence frequency, or other domain-specific metrics. For example, nodes representing companies in the same industry or with similar business models may appear closer together in a network of companies, indicating their relatedness.
Clusters and Sub-themes: Clusters are groups of nodes densely connected internally but sparsely connected to nodes outside the group. Clusters often represent sub-themes, categories, or communities within the overall network. The presence of distinct clusters in a network suggests the existence of different sub-domains or specialized areas within the broader topic or dataset. For instance, clusters in a network of research papers may represent different research subfields or theoretical approaches within a larger academic discipline. Analyzing the characteristics and composition of clusters can provide insights into the structure and diversity of the studied domain.
Network Density and Diversity: The overall density of a network refers to the proportion of actual connections between nodes compared to the total possible connections. A dense network indicates high interconnectivity and similarity among the nodes. In a dense network, nodes are closely related, and the represented domain is likely to be more homogeneous or focused on a specific theme. Conversely, a sparse network with fewer connections and more isolated nodes or clusters suggests a higher diversity level or distinct sub-themes within the domain. A network with dense clusters and sparse connections between clusters indicates a balance between specialized sub-domains and broader connectivity across the entire network.
Clustered ArXiv Research Papers Abstract Focused on Machine Learning and Autonomous Systems - Reinforcement Learning Bridges the Clusters Between Systems and Optimal Path Planning

Bridging Nodes and Connectors: Bridging nodes, also known as connectors or hubs, connect different clusters or sub-domains within the network. These nodes are crucial in facilitating information flow and linking disparate network parts. Identifying bridging nodes can uncover key entities, individuals, or concepts that span multiple sub-themes or serve as intermediaries between different communities or areas of expertise. For example, in a network of scientific collaborations, a researcher collaborating with multiple research groups across different subfields may act as a bridging node, fostering interdisciplinary knowledge exchange.
Evolution and Temporal Dynamics: Networks can be analyzed to observe the domain's evolution and temporal dynamics. By comparing network snapshots at different time points, researchers can track the emergence of new themes, the growth or decline of specific clusters, or the shifting importance of certain nodes. Temporal analysis can reveal trends, patterns, or significant events that shape the development of a field or industry. For instance, in a network of technology patents, the emergence of a new cluster over time may indicate the rise of a disruptive innovation or a shift in technological focus.
Visualization Options
In network analysis, clusters of multiple nodes can be grouped to provide a more direct summary of their connections. Each node can also be sized by any structured data point, such as the number or amount of investments, network metrics such as centrality or degree, time frame/temporal data, and proprietary metrics or rankings as long as the data is structured. Any of the former can also color them to contextualize the multiple dimensions of raw data.
Investments In Machine Learning and Autonomous Systems (Crunchbase Data)

Tagging is also possible within the networks, which can help identify, cluster, and analyze to reflect the data better, which the unsupervised machine learning approach might not highlight. For example, below is the same network as above but colored by custom tags of relevant areas of specific interest.

Organizations can also use network analysis to uncover risks, stakeholders, blind spots, and opportunities that traditional analytics or dashboards may miss. For instance, in 2015, few knew about the relationship between GDPR and the use of machine learning in healthcare. By utilizing network analysis to scrutinize news data on GDPR and cloud data transfer protocols, it was possible to identify thematic connections that indicated that GDPR could indirectly impede medical research.
Advanced Network Analysis Surfaces GDPR's Potential Negative Impact on Scientific Research Years Before Leading Science Journal Caught On
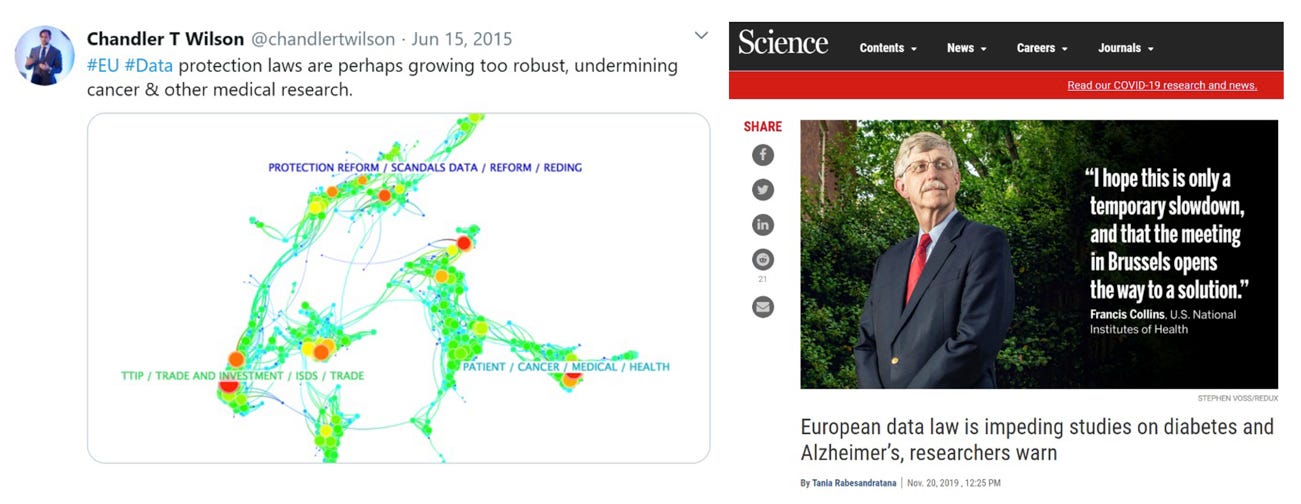
It wasn't until 2019, four years later, that leading researchers such as Francis Collins highlighted the challenges caused by GDPR in modernizing health research that the connection was recognized. In another instance, during the Hong Kong protests, banks and companies needed to identify which region potential money would flow to. By looking at the network of past migration patterns, it was possible to model the cascade effects of regional hubs, leading to better strategies on which areas to allocate resources to.
Migration Flows Network Hubs

Bridge Nodes, aka Hubs within Eurasia and the Mid-East
Kuwait (KWT) connects the UAE and India (red) nodes.
Saudi Arabia (SAU - purple node) remains the most insular.
Europe is most tied to the clusters of Hong Kong and China (yellow).
PDF documents can also be analyzed. In the example network below extracts the key themes from a PDF of the CSET U.S. Military Investments in Autonomy and AI: A Budgetary Assessment Policy Briefing. We can see that much of the topical thematics are focused on research, indicating it is in the early stage, and the sub-thematics are focused on AI and humans, indicating integration or hybrid systems.
CSET U.S. Military Investments in Autonomy and AI: A Budgetary Assessment Policy Briefing Network

Business leaders often find themselves surprised by the complexity present within their initial area of focus. Network analytics addresses this challenge by representing entities as nodes and relationships as edges, allowing executives and investors to visualize and analyze the complex interactions within a sector. This data-driven approach helps navigate the intricacies of sectors and markets, empowering investors to make informed decisions and uncover valuable insights that traditional financial analysis may not reveal.
The advantages of network analysis are numerous, including the ability to identify influential entities, surface undervalued opportunities, uncover emerging trends, assess the impact of events, and evaluate the resilience of systems. The techniques can be a valuable tool for navigating the complexities of modern business environments, uncovering actionable insights, and informing strategic decision-making. By embracing network analysis techniques and integrating them with other data-driven approaches, organizations can gain a competitive edge, identify risks and opportunities, and adapt to the ever-changing landscape of their respective industries. As the world becomes increasingly interconnected and data-rich, the importance of network analysis will only continue to grow, making it an essential skill for professionals across various domains.
Feel free to get in touch if you have questions.
- Chandler